New Yearly Dashboard Published on by luis in Documentation, New Features
We are happy to announce our newest feature: The Yearly Dashboard. Until now we had sent our users yearly reports summarizing how their year had gone. But with our new yearly dashboard, that information is now available all the time. Plus, we added some cool new charts too.
Why is the Yearly Dashboard useful for you?
The new Yearly Dashboard is designed to answer a lot of the questions you had regarding your yearly performances.
- Year Sums: See your year’s revenue, as a total or per agency
- Sales Breakdowns: Understand how your yearly sales are composed
- Compare Years: Are you doing better this year than last year?
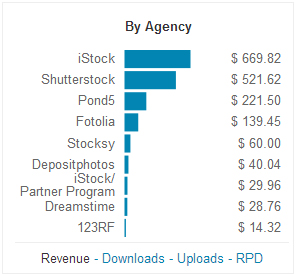
Sales Breakdowns with the New Horizontal Bar Charts
With the introduction of the Yearly Dashboard, we took the opportunity to work on a new type of chart: the Horizontal Bar Chart. We like it, because it best displays the relationships between various categories and is a good tool to display sales breakdowns. And because it is so easy to read, soon you will be seeing it in many different places on Stock Performer!
For example, here’s a horizontal bar chart displaying Sales by Agency:
Comparing Years
As the stock media industry evolves, you want to know how it affects you and what is changing. To make that easy, we added the option to compare years. You want to know how 2014 is doing compared to 2013? Use the comparing pull down menu to choose a year to compare to:
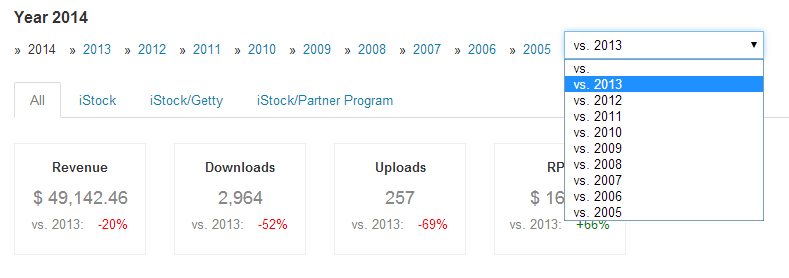
The above screenshot displays 2014 sales compared to 2013, as of the current 2014 month. In the screenshot, revenue in 2014 is down 20% compared to the same period in 2013.
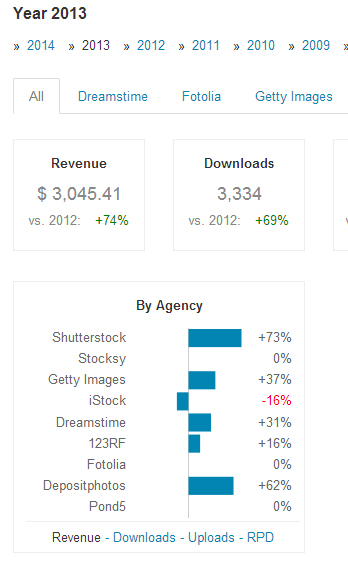
In fact, we allow you to compare more than just the total values. The Sales Breakdowns Charts also show the comparison values. In the following sample screenshot, you see a revenue comparison by agency between 2013 and 2012. Revenue on Shutterstock increased by +73% while it decreased on iStock by 16% during that same period.
Yearly comparisons for a wide variety of sales attributes will let you pinpoint exactly how the industry evolution is affecting you and how best to react.
Launching Your Yearly Dashboard
It’s simple to access your Yearly Dashboard. On your main Overview, you will find a new link:
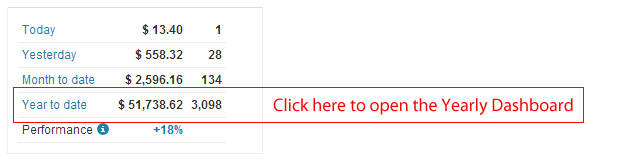
Click on “Year to date” and it will take you there. Your dashboard is divided in an “All” section, with all summarized data, and then one section for each agency. For each agency we will give you the sales breakdowns relevant to that agency. Here is a sample screenshot of iStock demo data for the 2014 Yearly Dashboard:
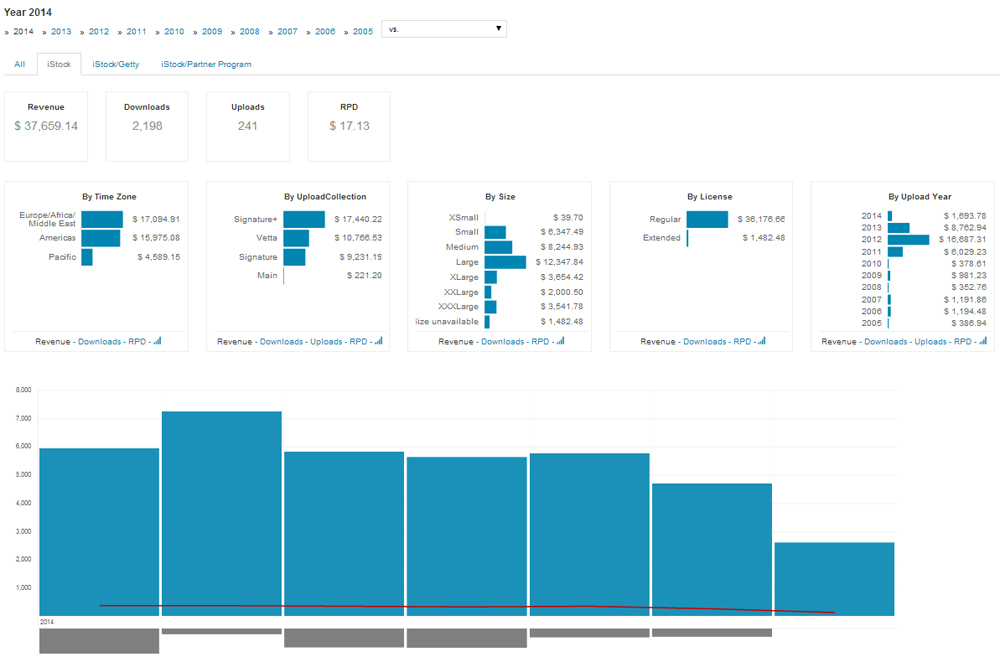
Briefly looking at the sample yearly dashboard you learn that:
- Most 2014 sales occur in Europe/Middle East/Africa
- Signature+ is the iStock collection which brings most revenue
- Large file sizes sell best in 2014
- Most sales in 2014 come from files uploaded in 2012
Go ahead and play with your Yearly Dashboard to discover what indicators are important to you.
Want to try the new Yearly Dashboard? Sign up to Stock Performer, the first month is completely free!