Are contributors uploading less since the pandemic started? Published on by luis in Best-Of Articles, Insights, Stock Performer
2020 is turning out to be a pretty rough year. The current SARS-CoV-19 virus has affected most aspects of economic life and the microstock business is no exception.
But while microstock contributors have seen restrictions of all types hinder their ability to produce new imagery, they have also seen an unprecedented increase in demand for corona-related imagery. The novel coronavirus and the associated health regulations have changed overnight the type of imagery customers are looking for and they need lots of it at the moment.
How has that affected upload patterns? Are contributors uploading less? More? When the pandemic started spreading we ran a short survey among contributors asking them how they believed the pandemic would affected them.
Now, eight and a half months into 2020, we decided to look at how our customer’s upload behavior has changed in reaction to the new business environment. (Please note that for this analysis we only use data from those customers who have opted-in to our data sharing program, which enables them to get their performance rankings and other reports).
We analysed how much this set of customers upload each month to the three biggest agencies we track: Adobe Stock, iStockphoto and Shutterstock and did that for both 2019 and 2020, in order to have some historical perspective.
Adobe Stock
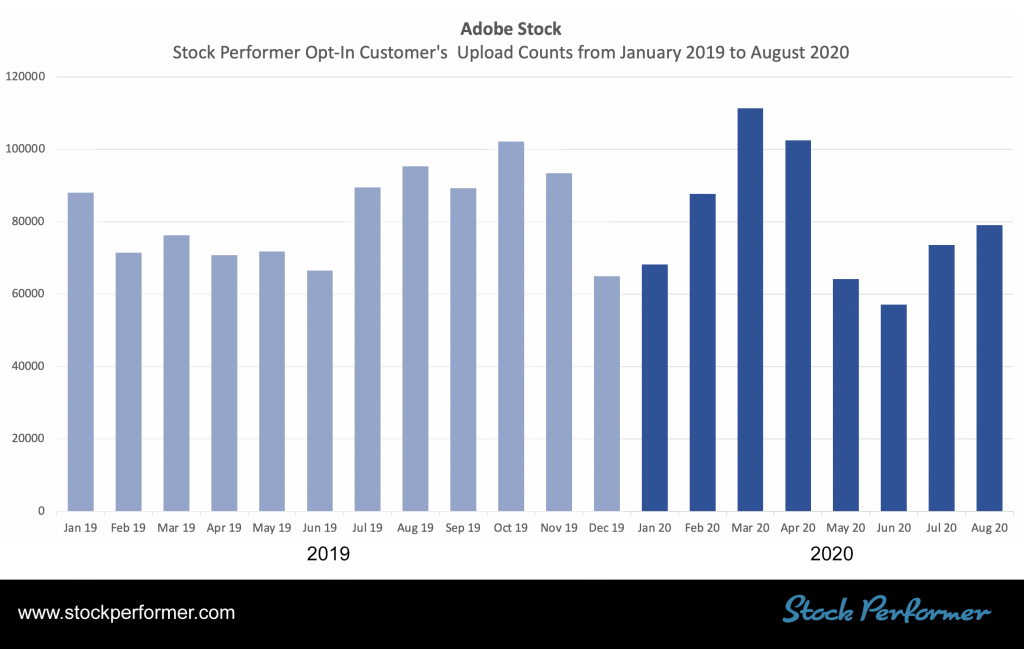 Monthly uploads in our data set to Adobe Stock in 2019 and 2020
The first chart we present is the upload pattern to Adobe Stock. Before you ask, we do not share the number of customers we have, so instead, we added the counts on the chart for you to have a sense of the size of the sample.
In March 2020, when the lockdowns started kicking in worldwide, our set of customers uploaded the most content with about 110,000 uploads in one month. It seems as if the lock down and the extra time at home allowed people to catch up on all the good content they had on their hard drives and upload it.
Shortly after, in May and June, upload numbers decreased and were below 2019 levels. One can only speculate, but we believe this is caused by the fact that it was almost impossible to produce new content in March and April. Similarly, July and August remain below 2019 levels.
From looking at this graph, one can get the impression that the pandemic has reduced the ability of this set of customers to produce new content as freely as they did in 2019.Shutterstock
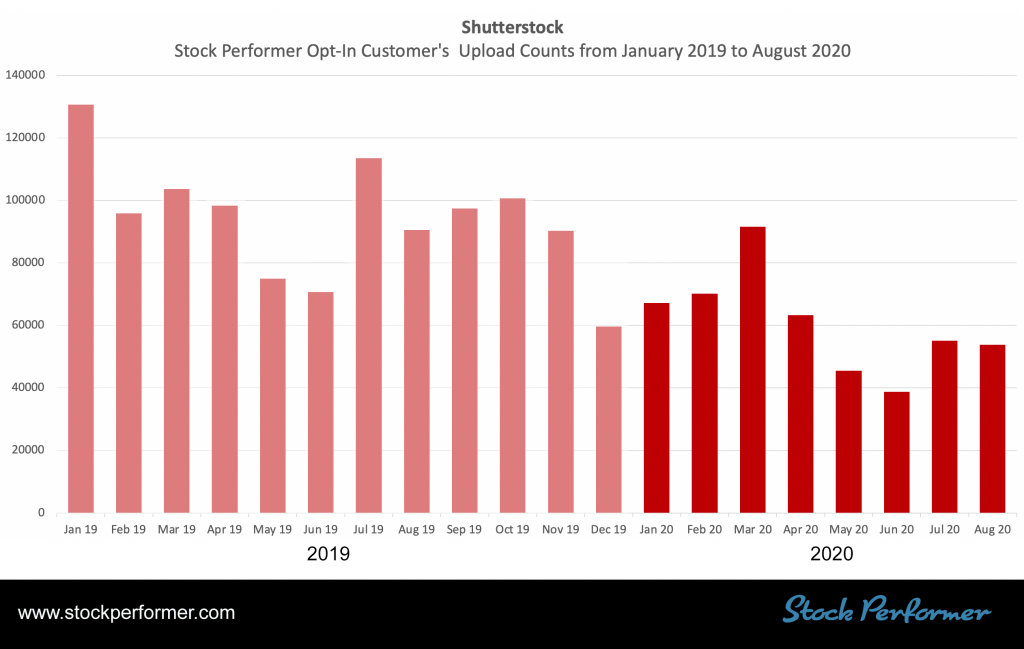 Monthly uploads in our data set to Shutterstock in 2019 and 2020
Shutterstock’s chart is very interesting because it differs a lot from Adobe Stock’s chart. At first glance it seems like there is a long term downward trend in monthly uploads. The highest month happens to be the oldest month of all: January 2019. From there onward uploads decrease steadily.
After talking with some of our customers, they told us that Shutterstock has increased the acceptance standards, making it harder to get content accepted. Since we only track accepted content, this could be an explanation why less and less content is accepted.
The pandemic did have a similar effect as with Adobe Stock. This subset of our customers did upload a lot in March 2020, probably also catching up on their previous productions. But afterwards the effects of lockdown plus the higher acceptance standards probably reinforced the general downward trend in accepted uploads.iStockphoto
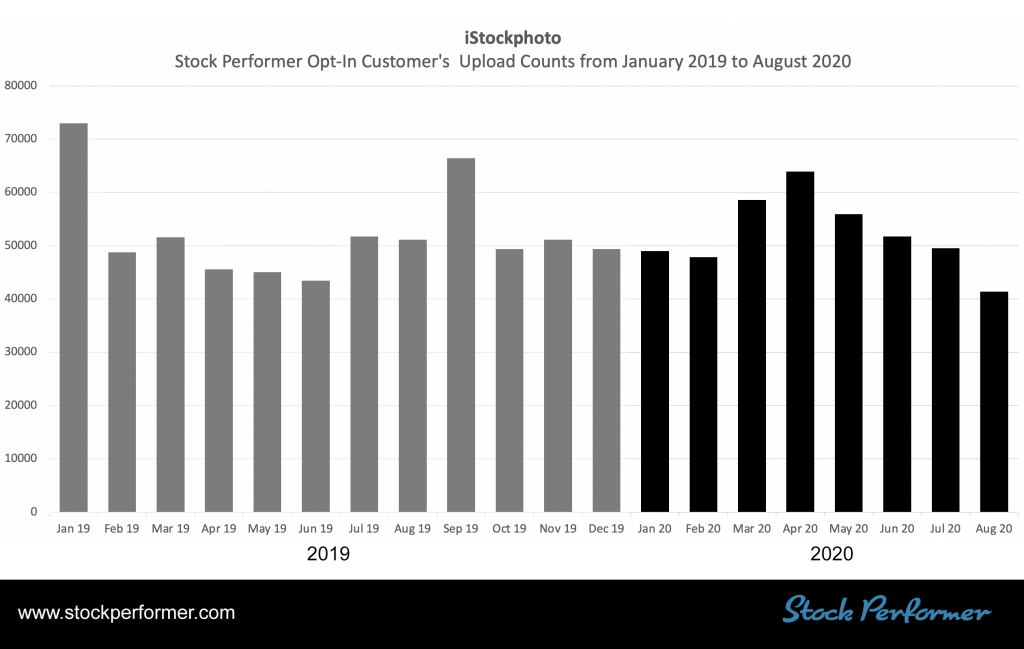 Monthly uploads in our data set to iStockphoto in 2019 and 2020
The iStockphoto chart seems to be the most stable of the 3. Apart the peaks in January 2019, September 2019 and the lockdown months of March and April 2020, the remaining months are pretty constant and stable.
Please note that our data for August 2020 is not yet complete, since many August uploads were still in the inspection queue and not yet accepted. So it may be best to be ignore them.
In this data set we have a mix of exclusive and non-exclusive contributors, so it would seem that together they produce a fairly regular output.Conclusions
Based on our data set, we can say that while all agencies saw an increase in uploads in March and April 2020, it seems that the pandemic had the most visible effect on Adobe Stock. On Shutterstock and iStockphoto that effect does not seem so large. Shutterstock has seen a downward trend well before the pandemic started and iStockphoto has had a fairly constant input of content.
What do you think? How would you explain the differences between the above 3 charts?
You enjoyed these insights? Then read more here: Insights
Sign up to Stock Performer and see how we can help you make more money. The first month is completely free!