Are you uploading enough files to make money from microstock? Published on by luis in Best-Of Articles, Insights, Stock Performer
Every contributor works hard to produce new content each month. And as they do, they hope their new content doesn’t end up being just one more grain of salt in an ocean full of new uploads.
To address that issue, we wanted to find out how fast is the rate of uploading really growing year after year? How much more do contributors upload today than they did, say 10 years ago?
Ultimately, as a contributor you want to know if you are growing as fast as the market? Or whether you are being left behind.
We decided to look into the uploads we track to see if we identify any patterns and here are the results.
We focused on Shutterstock, Fotolia and iStock
For our analysis, we decided to focus on the 3 largest agencies: Shutterstock, Fotolia and iStock. The vast majority of contributors are members of at least one of these three, so most readers will find this data relevant for their work.
We aggregated all uploads for each of these agencies for the years 2007 to 2016. In order to compare the rate of growth on each agency, we set 2007 as a starting point: we normalized the data so that 2007 has the equivalent of 1 upload on each agency.
For each Shutterstock upload in 2007, there were almost 80 in 2016!
We start off by showing the first graph with our results. In this graph, we wanted to compare upload rates with respect to 2007 (ten years ago) to answer the question, how much more are people uploading per month today, than they were 10 years ago.
To achieve that, we normalized all values so that 2007 starts with 1 upload per month on each agency.
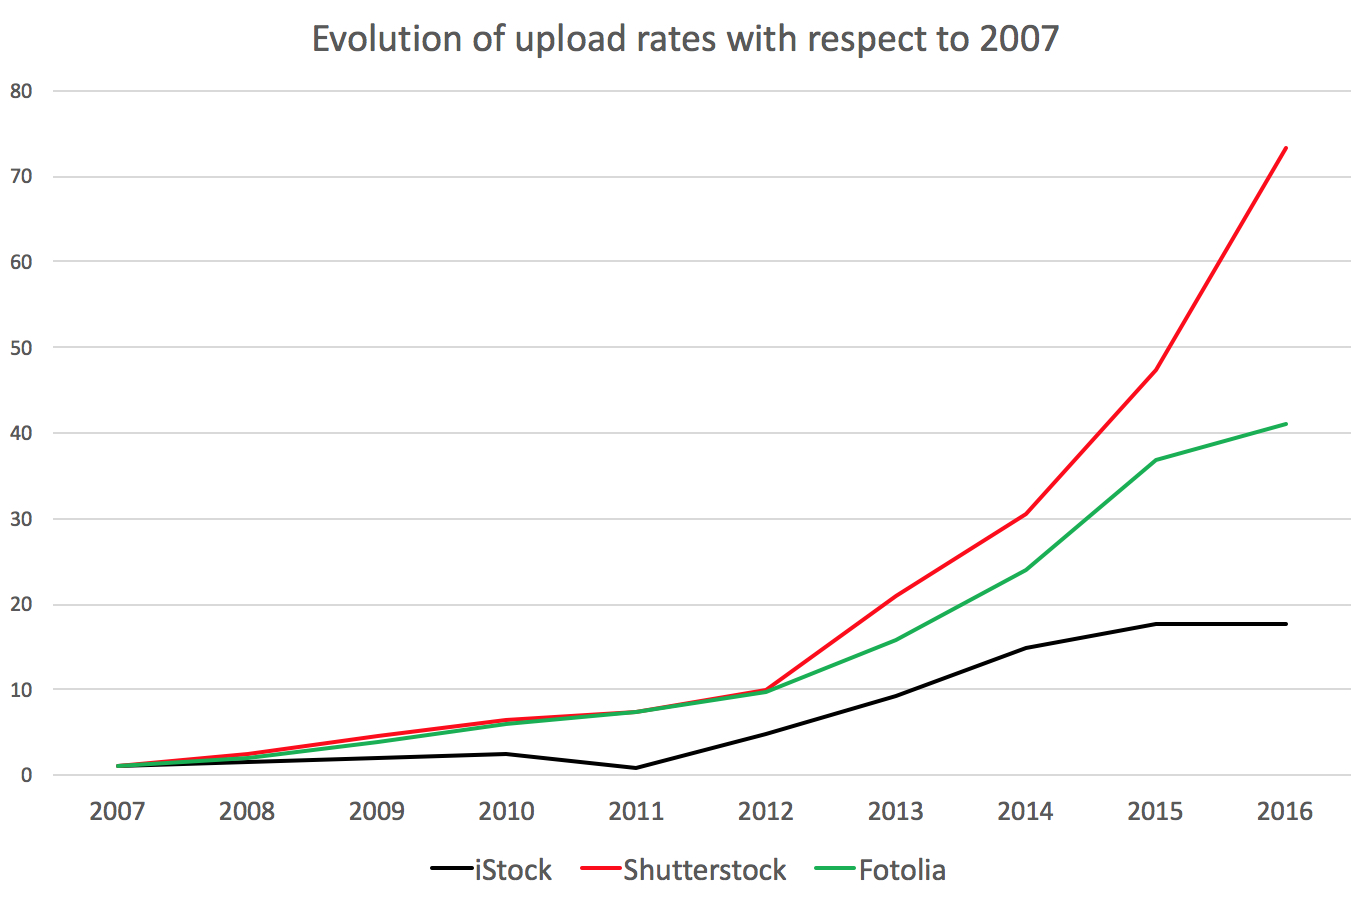
From this chart, we can learn the following:
- For every Shutterstock upload in 2007, there were 73 in 2016.
- For every Fotolia upload in 2007, there were 41 in 2016
- For every iStock upload in 2007, there 18 in 2016
What’s clear from this graph is that Shutterstock has experienced the largest upload rates growth, with a curve depicting almost exponential growth!
iStock’s upload rates, on the other hand, had a moderate growth, with contributors uploading about 20 times more in 2016 than they did in 2007, much lower than the 73 uploads on Shutterstock.
Until 2014 all agencies received more or less the same amount of uploads, then things changed
For the next graph, we did not normalize the values. Instead, we used the absolute values. This allows us to compare each agency against each other in absolute terms. How much more do people upload on one agency with respect to the other?
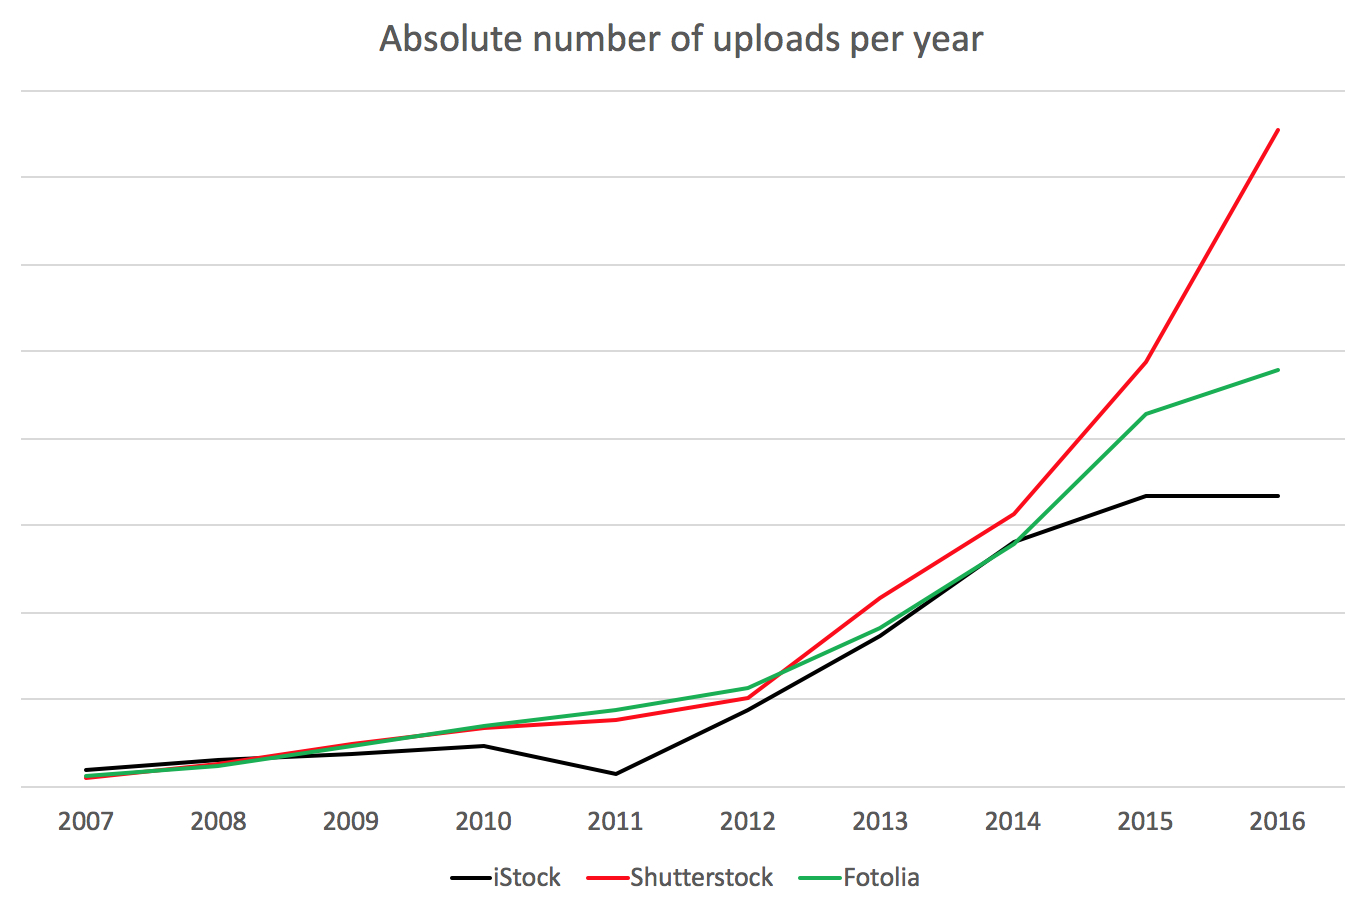
The interesting aspect highlighted by this graph is that until 2014, the upload rates grew similarly at each agency. People were increasing their uploads at the same speed on all three.
However, starting in 2015, Shutterstock upload rates per year increased dramatically. Fotolia also experienced a larger intake of files. On the other side, iStock remained constant taking in almost the same amount of files in 2014, 2015 and 2016.
In what months are most files uploaded?
When looking at upload counts per year, it is interesting to know what the distribution over the different months is. When do contributors upload most of their content?
The following chart describes very clearly when the peak upload seasons are.
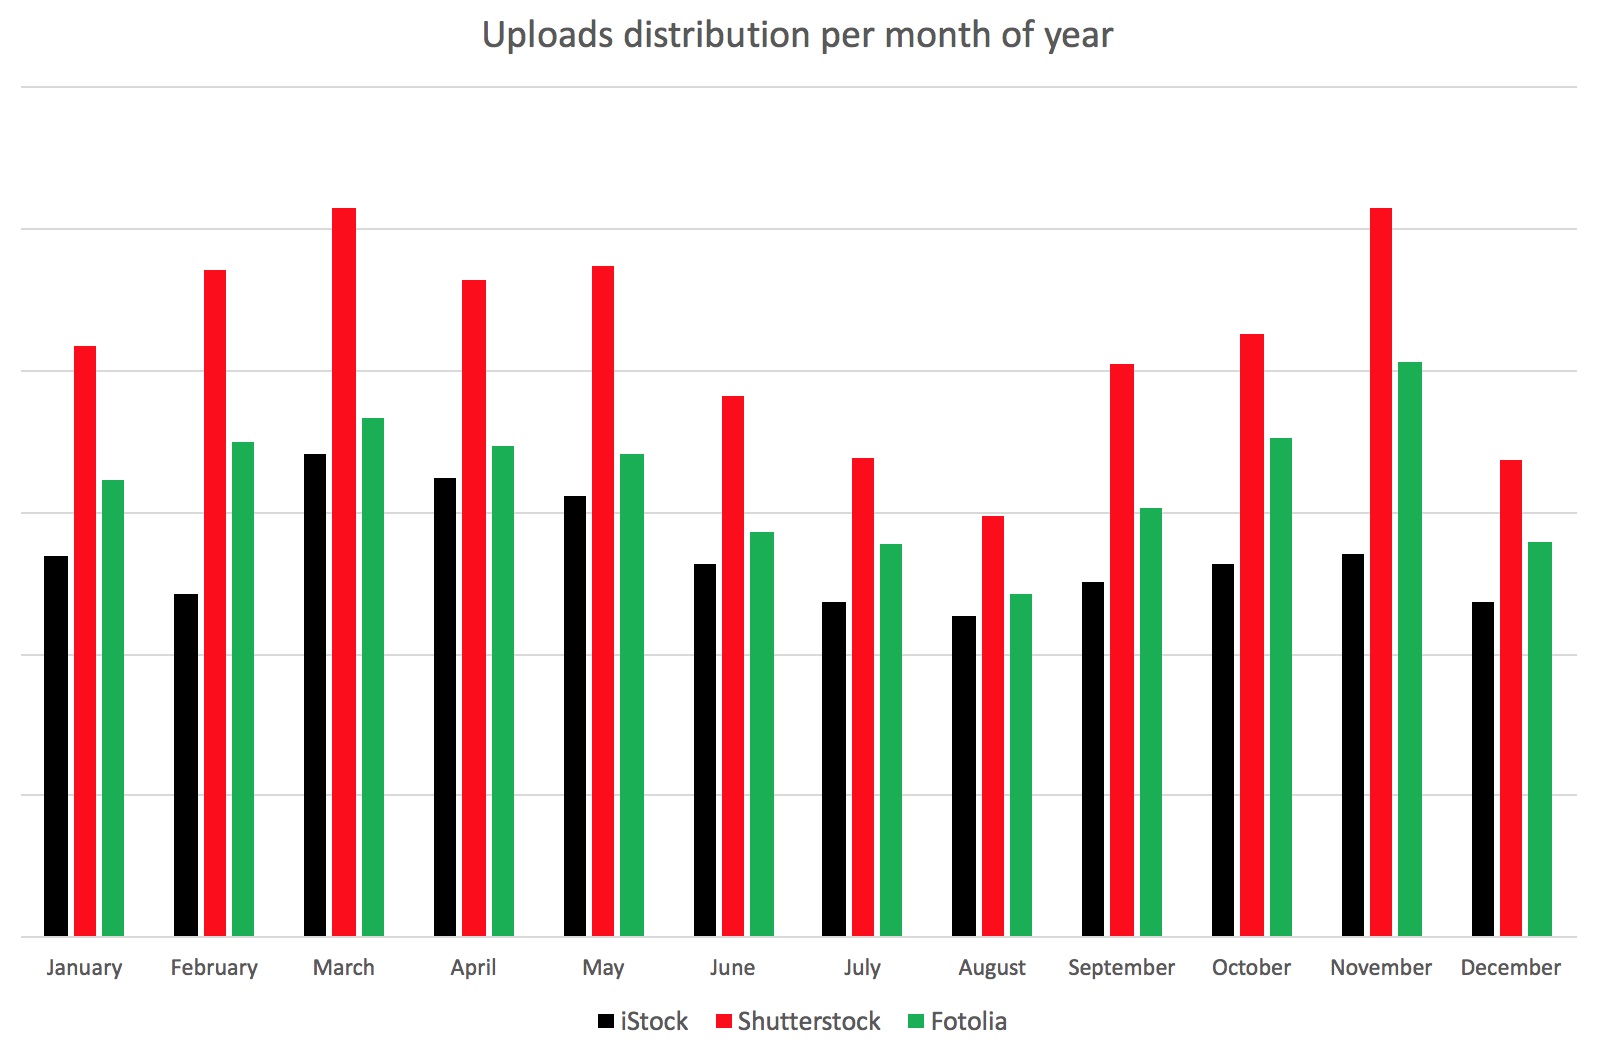
Both March and November represent the months when most files are uploaded. During the hot summers in the northern hemisphere and during the Christmas holiday season contributors are probably resting and don’t upload as much.
However, it is interesting to see that the peaks and troughs are not quite the same on each agency. iStock has its peak in March whereas Fotolia has it in November. And Shutterstock on both those months.
Swim against the tide and upload when everybody else doesn’t!
If you make it a goal to upload when everybody else is resting, you give your files some fresh oxygen when trying to make it in top positions of the best match algorithms. Keep that in mind when uploading.
Conclusions
Our analysis confirms the common belief that uploads rates are only increasing. In fact, they are growing probably faster than most contributors can keep up with. Especially on Shutterstock.
These results do raise some interesting questions:
- Are there more contributors, creating more content?
- Are these more or less the same contributors uploading more than they used to?
- If the same contributors are uploading more each month, why is it? Are they simply enjoying ever increasing income and financial freedom? Or perhaps they are struggling to keep their income levels constant and fighting back with more uploads?
- How do these upload figures compare against the evolution of income? Are uploads growing as fast as income or slower?
- Are the upload rates growing at different speeds because the acceptance policies have changed? i.e. become more relaxed thus accepting more files?
We will be diving into these issues in the coming weeks and month trying to make sense of it all and understand how the market works.
If you are a Stock Performer customer, you can already see how your uploads rank against the market and discover whether you are under or over performing. Use that information to react and stay ahead of the game!
Sign up to Stock Performerand start getting accurate market analytics to increase your performance ! The first month is completely free!