Forecasting revenues: How we apply the science known to airlines to your microstock sales. Published on by Oliver in Insights
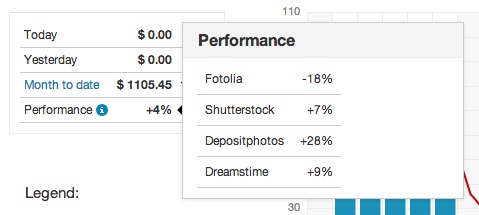
After numerous requests, a few days ago, we launched our “forecast per agency” feature. We had already shown you a forecast in the all-time revenue chart: The empty revenue bar gives you an estimate how much you will earn this month. Now, when you select an agency, you can also see that forecast for that agency. This also works with the performance value: If you hover with your mouse over that value, you’ll see a breakdown per agency. Try it! You’ll be amazed how your agencies are doing in comparison.
The idea for this came early on. I’ve been working for almost ten years in the area of Revenue Management. The software I worked on forecasted how many airline passengers would buy plane tickets for a given flight in the future. As an airline, once you know your future demand, you can decide on the optimal price for a ticket. All major airlines do this. These days, you cannot survive without understanding your customers’ behaviour through the data you have.
But how do we at Stock Performer forecast your revenue?
It turns out that buyers behave in a predictable fashion, too. You already know that weekends tend to be weak while on Tuesdays or Wednesdays, you often have your strongest sales. We can take this information and extrapolate to the end of the month. So when your “performance” for that month is negative, it is often not your fault: It may just be that that month has more weekends than the month before.
Note that this works well when there are a lot of sales. People with very few sales may see a lot more fluctuation in these numbers. And sometimes, an unexpected high-value Extended License may push the balance up a bit. In general, however, our experience is that these numbers are quite stable.
We’ve been asked if the forecast algorithm knows that sales during the Christmas holidays tend to be low. The answer is no. It also doesn’t know how sales change when an agency changes its search algorithm. These are things that are hard even for experts to estimate.
Back at the airlines, there are people who spend their days adding all that extra information: holidays, special events, natural or political incidents. At Stock Performer, we’re keeping it simple for now. But we’re always interested in how the forecast works out for you. Feel free to send us feedback at any time.