New Feature: Collection Costs, Profit and Loss Published on by luis in Documentation, New Features
We are pleased to announce Stock Performer now tracks your collection’s costs, profit and loss in real time!
Stock Performer’s collections has always been a very popular feature to group images and track their performance. Now you can also track their profit and loss, giving you a better insight into your business’s profitability.
How does Collection Costs, Profit and Loss work?
You can now enter each collection’s cost figure in dollars directly into the overview table.
- Hover your mouse over the table and you will see a text box appear to enter costs.
- Simply click on a cost value to edit it.
Stock Performer then calculates profit or loss immediately, based on the collection’s revenues. The value is updated each time new sales come in.
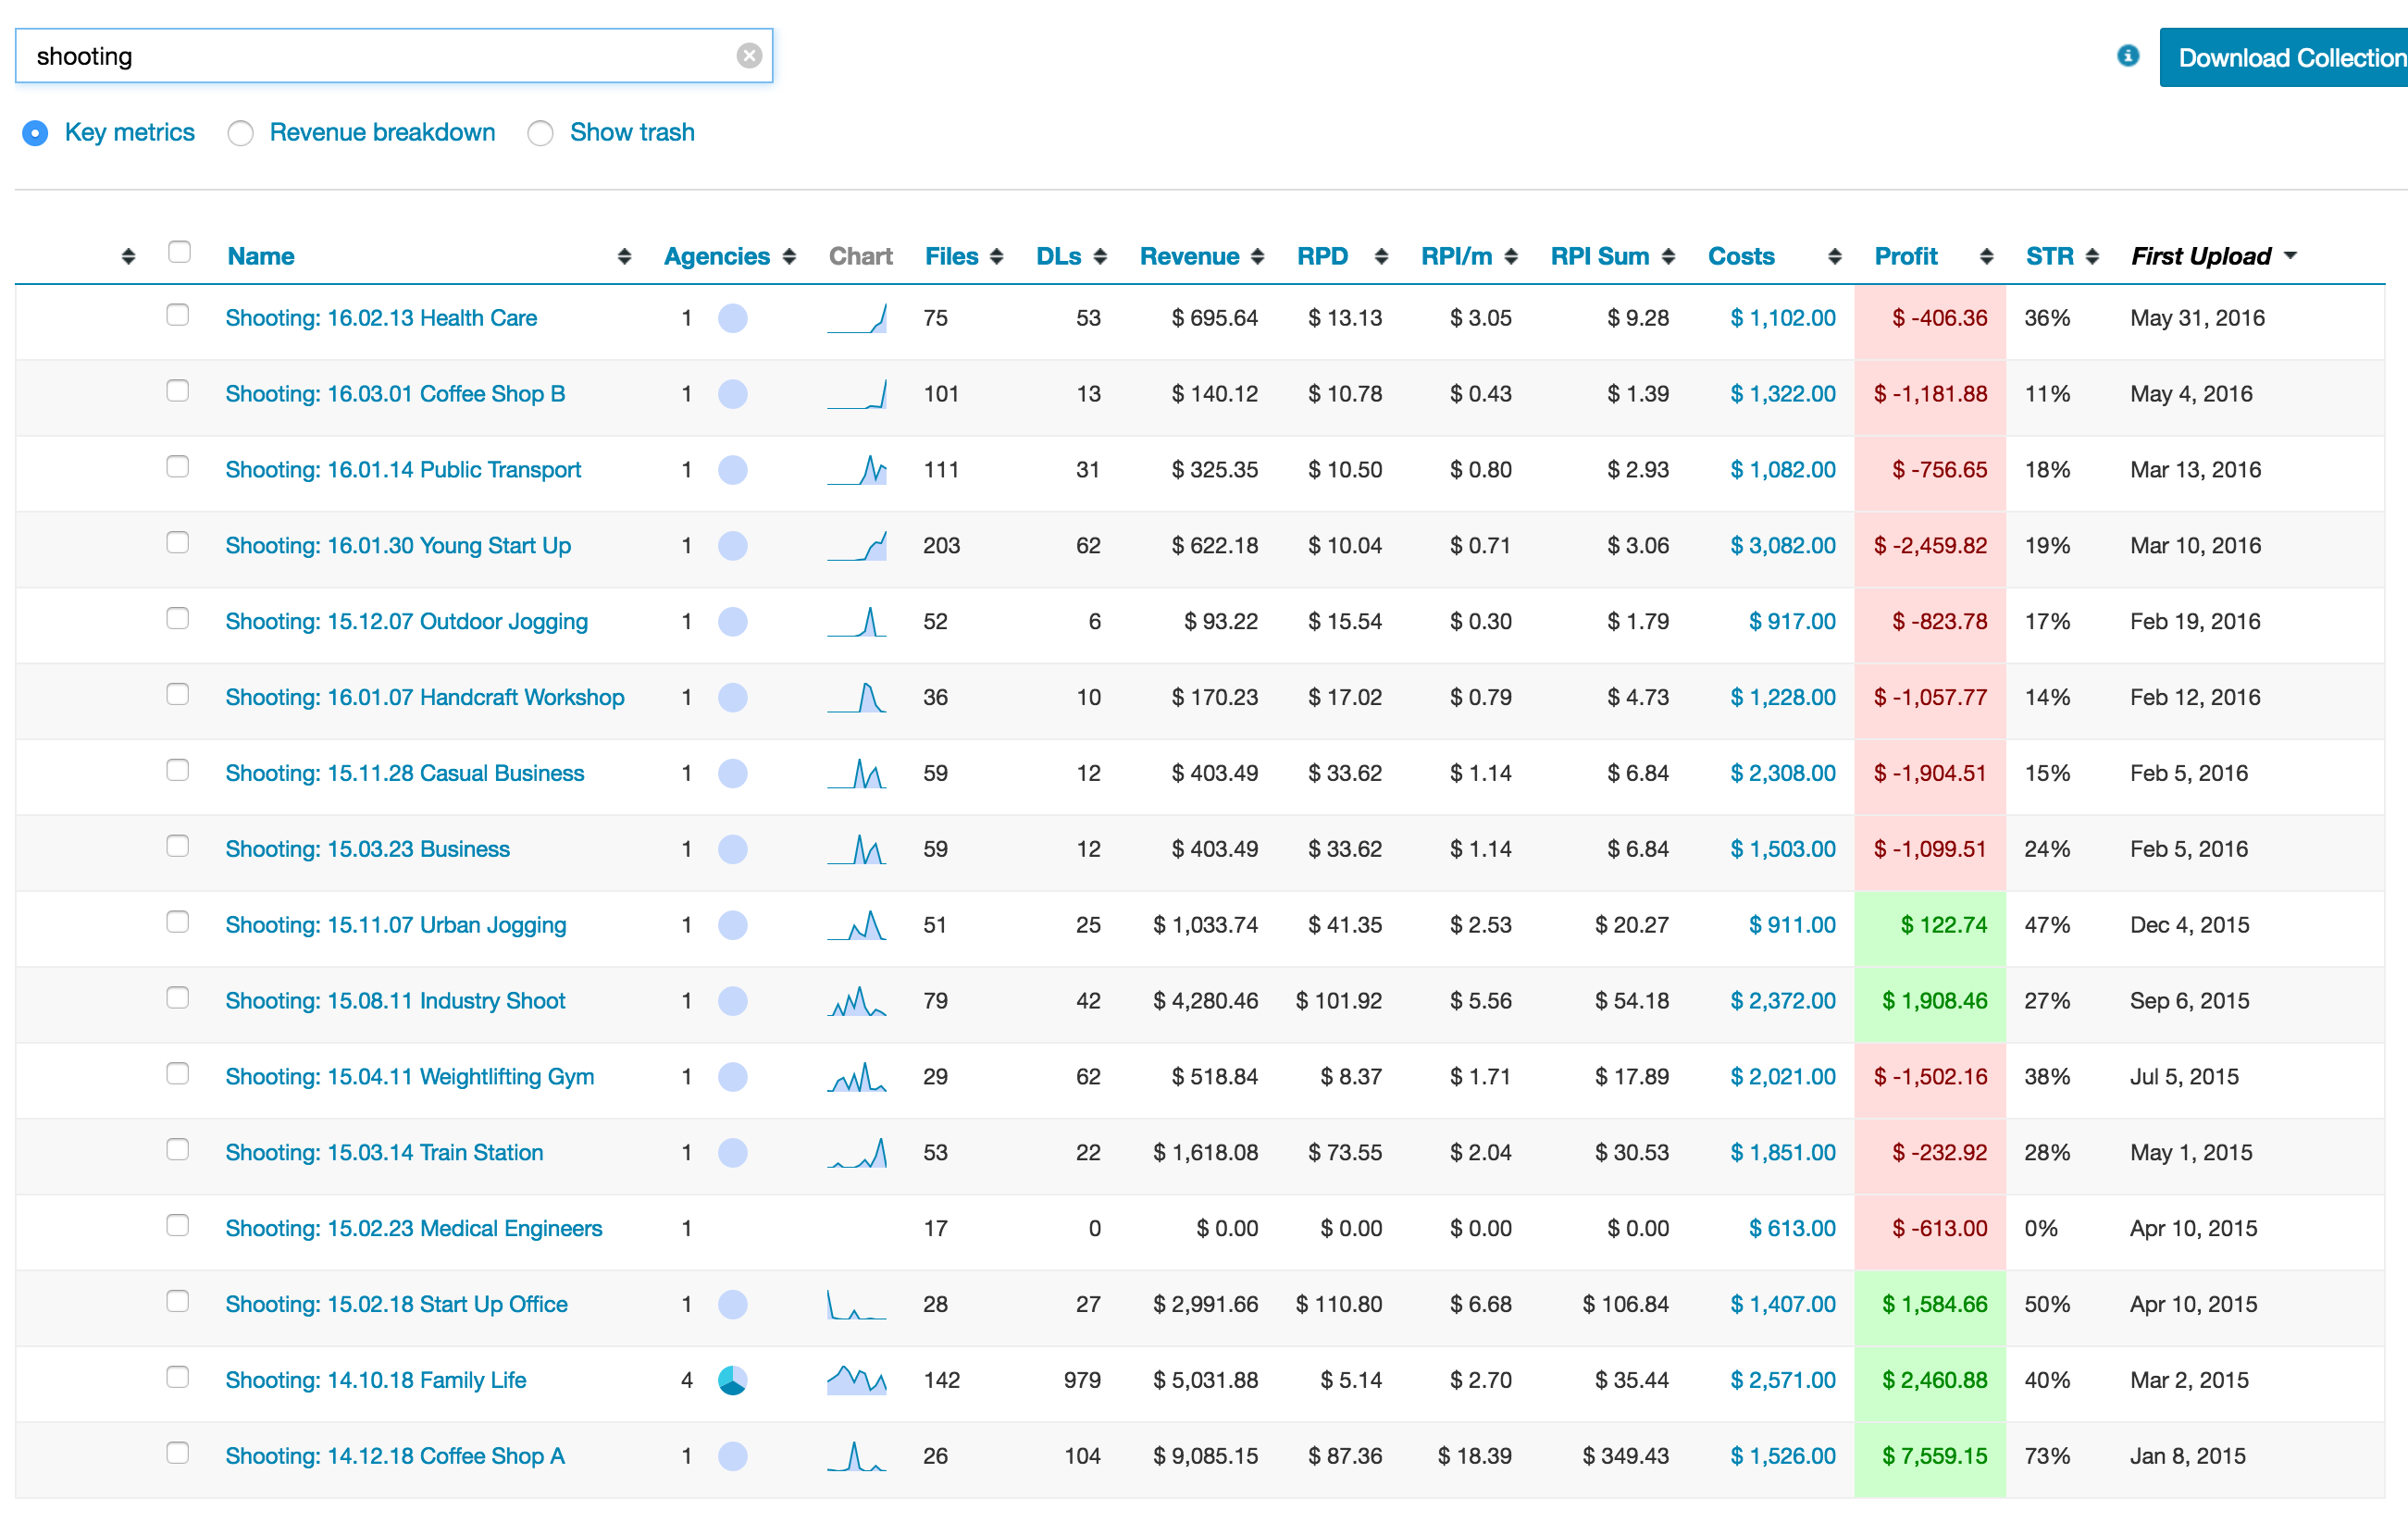 Profit and loss of various photo productions. All data is demo data.
Ideas on what profitability to track with Stock Performer
There are many different cases when you should track your profit and loss, but here are some ideas to help you make the most of this new feature.
Profit and loss calculation of your photo or video productions
For every production you will have costs, like models, travel, location, make up, rental equipment, etc. If you sum it up and enter the value in dollars, you will quickly see when you have broken even.
In this example, you see how the photoshooting “Family Life” has a positive return on investment. It cost $2,571 to produce and has already created $5,031.88 in revenue, resulting in profit of $2,460.88.
 Example of a profitable stock photo production.
Profit and loss of all productions of a specific year
For many, knowing if a year’s investment was worth it, is an important question. With this new feature it is now very easy to get an answer. You can use the “Merge” functionality to group all productions of a specific year. If you have entered cost values to each collection, then the resulting merge will include all those costs.
For example, if I want to know how much my 2015 productions cost and whether they are profitable, I can merge all 2015 shootings as shown in the screenshot.
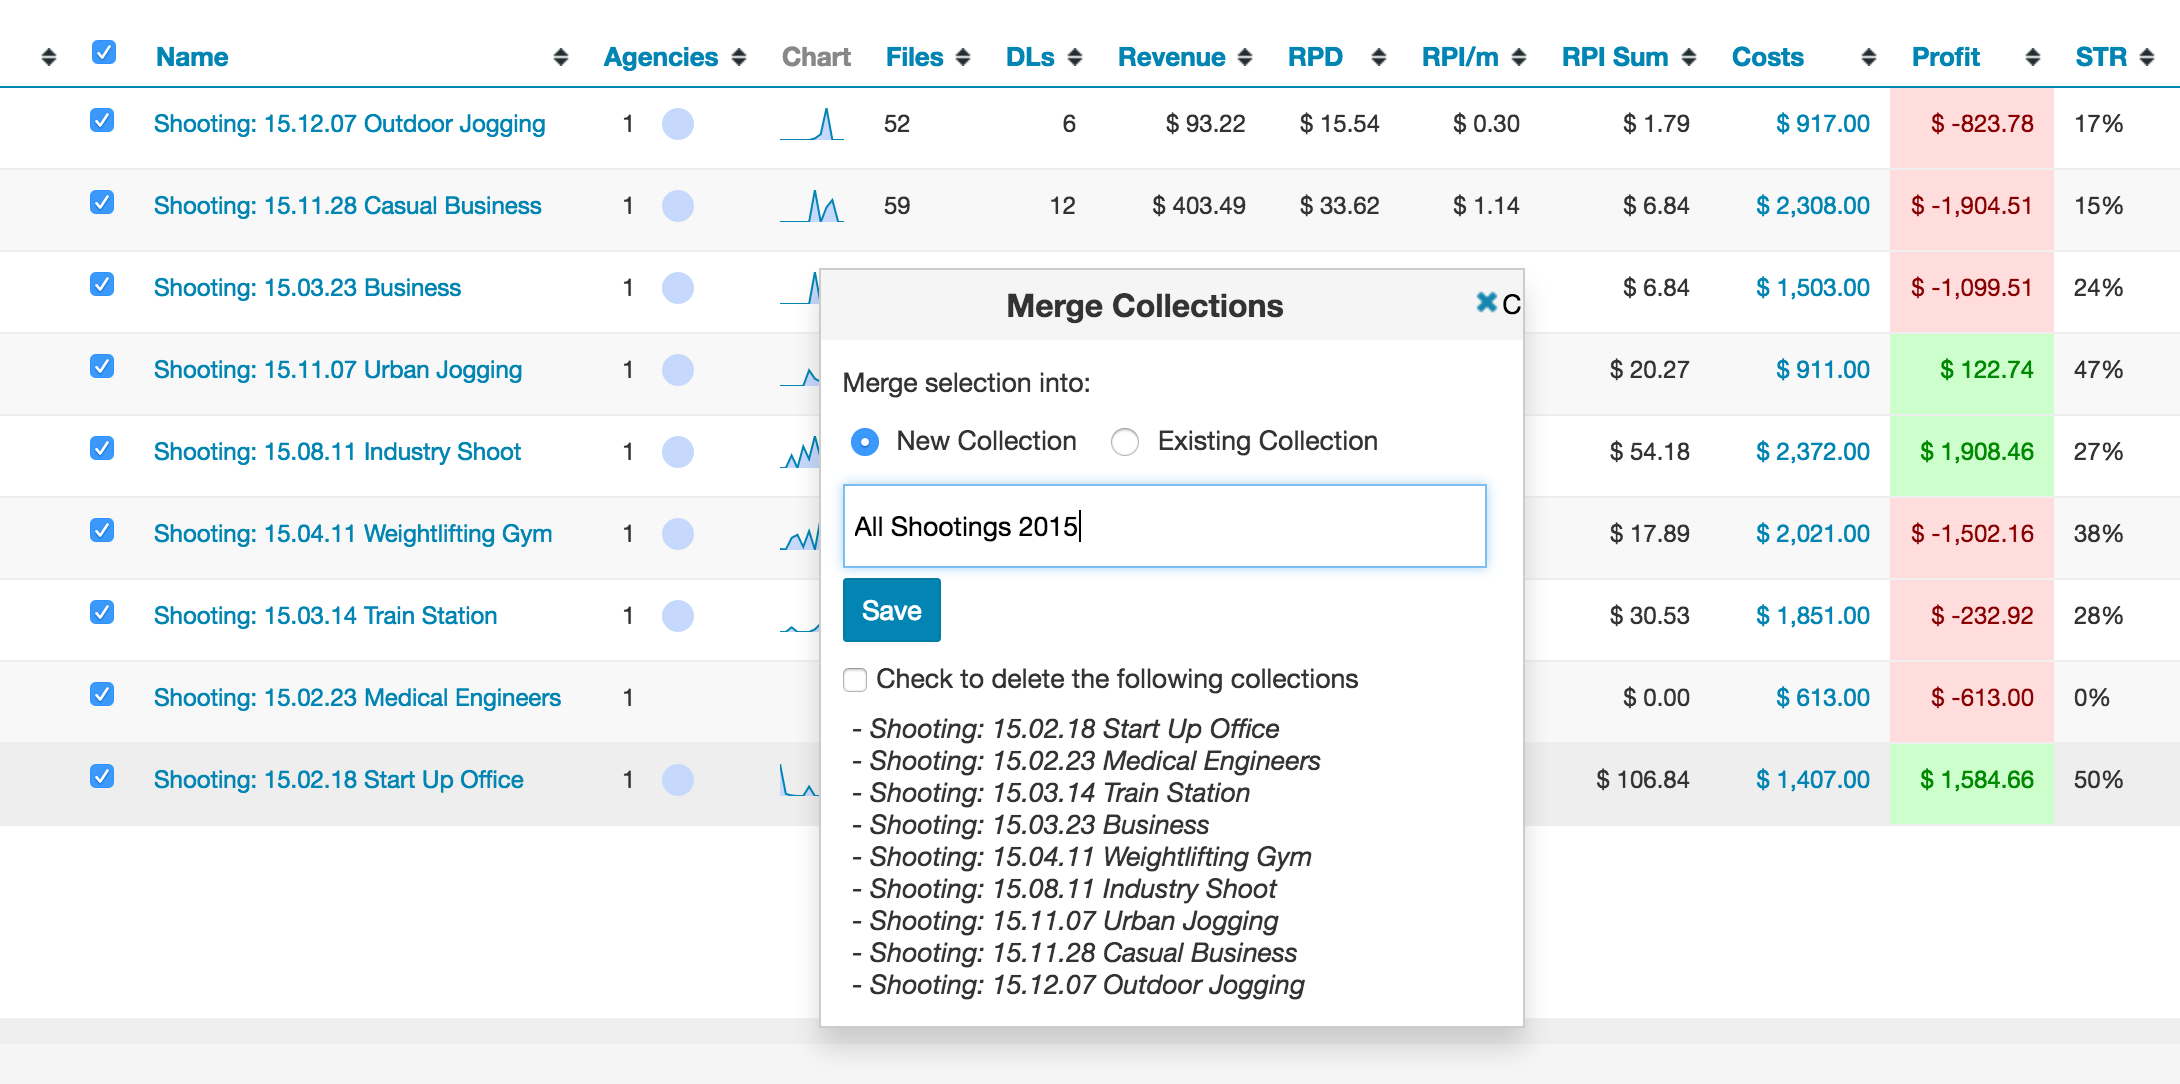 Merging all 2015 productions into one collection “All Shootings 2015”
The new collection will appear directly in the table, displaying the overall costs and profit. The profit value will update in real time with each new sales data entering the system.
 Quick view of how much all 2015 files cost to produce and whether they are profitable
In the above screenshot you see that 2015 images cost a total of $13,903 to produce, bringing $10,939.29 in revenue sofar, resulting in a current loss of $2,063.51.
Profit and loss of a hired videographer
Suppose you hire a photographer or a videographer to produce images for you. You can track the costs and see when you break even.
Here is an example of a collection including all the videos produced by a hired videographer.
The videographer worked on 8 productions at a cost $450 per shoot, resulting in costs of $3,600. He produced 165 videos. You can now see at a glance whether the investment has broken even!
 Videographer has cost $3,600 and revenue of the videos has not yet covered costs.
These are just some examples of all you can track with the new feature.
Collection costs in US dollars
Stock Performer’s main currency is the US dollar, since this is the currency almost all our agencies use. That is why you will need to enter your costs as US dollars.
We know that if your business works in another currency, you will have the added complexity that your costs and revenues will need to be converted. We recommend you use the currency rate at the time when you had your costs. For example, if your production took place in October 2012 and it cost you €1000, then use the currency conversion of October 2012 to find out the US dollar value. We recommend the following website: http://www.x-rates.com/historical
Next Steps
This is our first step in providing profit and loss metrics to our customers. We already have many ideas as to what is coming next!
We expect users to have different workflows when it comes to tracking and measuring their costs and profitability. But as always, we want to make sure our features cover as good as possible the variation in such workflows, so please provide us feedback on how you use the new profit and costs calculation and what you would need in the future.
If you have any questions or suggestions let us know via the in-site feedback box or via info@stockperformer.com
Sign up to Stock Performer and see how we can help you make more money. The first month is completely free!