New Feature: Performance and Market Ranking Published on by luis in Best-Of Articles, Documentation, New Features
Today we are launching the first of a series of features on Performance and Market Ranking for the stock media industry! You will now be able to see how you are performing and ranked compared to other users who opt-in to this feature. In the coming weeks and months, we will be developing this further.
This all started early 2014 when Oliver and me emailed a one-time 2013 yearly performance and ranking report to all our stock photographers and stock media artists who wished for one. We did this as an experiment and were surprised by the great feedback we got!
In 2015 users asked us to do it again. So we did. And as expected, early 2016 we again received many requests for a yearly analysis for 2015.
This time however, we decided to make it a permanent feature in Stock Performer. That’s why today we are launching our first version of this functionality!
Why is Performance and Market Ranking important?
Ever since Stock Performer was created, users have been asking us how well they are doing compared to others. This question is really fundamental and has so far not been answered by any system.
If you are having a bad day, its ok, as long as everybody else is having a bad day. But if you are the only one having a bad day, or a bad month, or a bad year, then you might have to review your workflow to improve.
Knowing how you are doing with respect to others helps you put your effort into perspective.
What is Performance and Market Ranking?
We have created a new graph, which displays how well you are doing with your sales, downloads and uploads compared to the overall market (i.e. the data of all opt-in users).
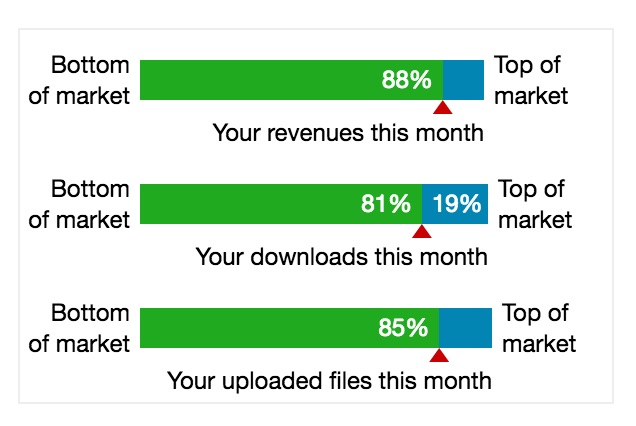
To understand how to read these bars, let us look at this example for revenues:
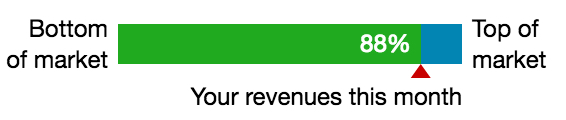
The „Bottom of the market“ represents the worst earner of all opt-in users. The „Top of the market“ represents the highest earner. Your position is marked inside the bar with a percentage value.
In this example it is 88% and it means that you are earning more revenues than 87% of opt-in users. Or read otherwise: 12% of users make more money than you.
You will see these ranking charts in various places:
- In the main overview you will see one for the current month.
- In the daily view, you will see your ranking for that specific day. You can even see your performance ranking for the current day.
- In the monthly view you will see you performance ranking for the selected month.
- In the yearly view you will see your performance ranking for the selected year.
And very important: you can see any of these performance rankings for your overall data or for a specific agency, for instance iStockphoto or Shutterstock.
So theoretically you could be having a bad month overall, but you may be having a great month on a specific agency. Or vice-versa. Play around to investigate.
How does Performance and Market Ranking work?
This new functionality crunches all sales, downloads and upload data from users who have opted in. Also note that for fairness, only opted in users get to see the performance rankings functionality.
As data enters Stock Performer, the rankings are re-calculated immediately. So everytime your browser is refreshed, you will get the most up to date performance ranking values.
Our metrics are all presented anonymously. It is impossible for you to determine who is positioned where. Only your position is displayed to you.
How large is the sample?
At the time of writing this, the rankings are based on over 25 million uploads and over 65 million sales on 11 agencies. So it’s a pretty large sample. Generally we don’t publish user counts but hopefully this info helps you get a feel for the significance of the ranking. As our user base grows, as well as the agencies supported, so will the size of the sample.
What are the next steps?
Now that we have launched this important feature, we are looking forward to your feedback and suggestions. Based on them we will start enhancing our performance rankings with new metrics and features, so offer a unique insight into your stock business, whether you are a photographer, videographer or other media contributor. So get in touch if you have any special requests!
If you have any questions or suggestions let us know via the in-site feedback box or via info@stockperformer.com
Want to know what your ranking is!? Sign up to Stock Performer and see how we can help you make more money. The first month is completely free!