New Feature: Profit/Loss Color Coding Published on by luis in Documentation, New Features, Stock Performer
One of Stock Performer’s most popular features is to track the profitability of your files. If you group files into Collections, you can enter their costs and see when they become profitable. This is very useful if you want to know how profitable a photo session was, a photo trip, a specific model or the files supplied to you by a supplier.
Until now we only had two colors: green for profitable (revenue – costs is positive) and red for losses.
To make this feature more useful, we now introduced two new colors. If a collection is 25% profitable and over, you will have a darker shade of green. And if a collection is 25% or less below costs, then you will see a darker shade of red.
The idea is that the darker the green, the more profitable the collection and the darker the red the most costly.
The reason why this is useful is because not all collections have the same level of costs and profit. So a profit of $500 may be a lot for a collection that only cost $100, but not very much for a collection that cost $5000. In order to better distinguish the size of the profit and loss, these new colors should be useful.
Here follows a screenshot to visualize it.
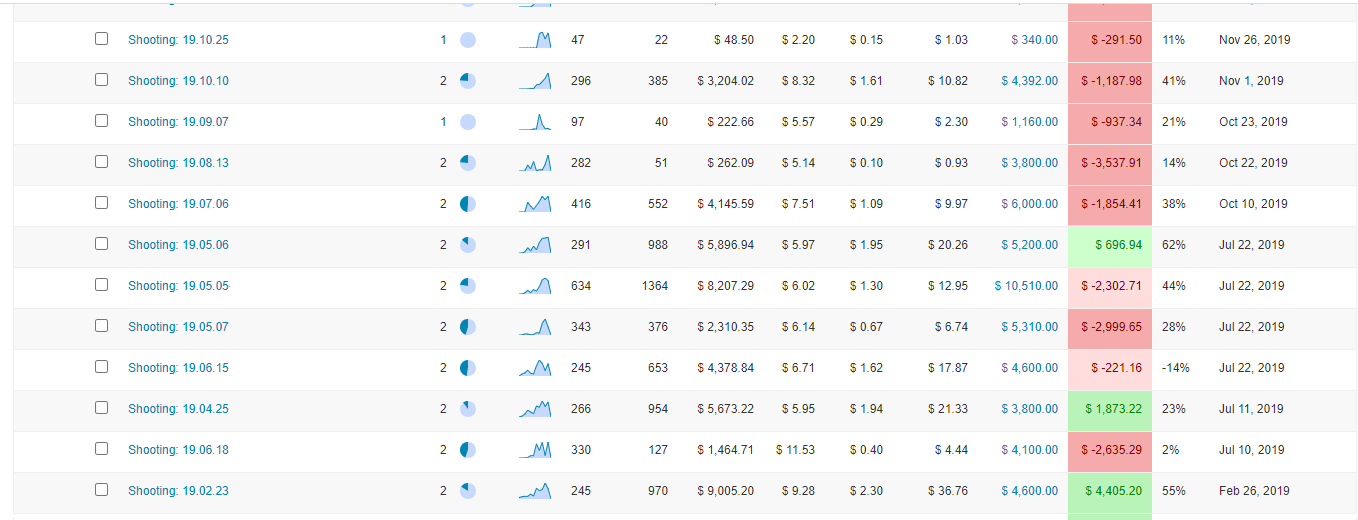
You should now be able to see at a glance which ones are the very profitable ones and which was are the least.
Let us know what you think!
Sign up to Stock Performer and see how we can help you make more money. The first month is completely free!