in Insights, Stock Performer

Slow start to the year? Or signs of a downward trend?

It is with a certain frequency that one can read gloomy stories about microstock’s demise and how the industry is running out of energy. Individual contributors complain about falling revenue and the difficulties of earning a sustainable revenue.

One of the best indicators of contributors’ health is how much they upload. If they are optimistic, they will put the time and money into producing new content. If they are pessimistic they will wind down their production and upload less.

At Stock Performer we have a small sample of the industry’s contributors. But we could argue this sample is a good representation of the top contributors. How else could they afford our subscriptions plans!? ๐Ÿ˜‰

So we decided to look at whether our customers (only those opted-in to our ranking program) are uploading more now than they did a year ago. We aggregated all uploads in January 2020 and compared the sum with all uploads from the same contributors in January 2019.

The following chart visualizes the results:

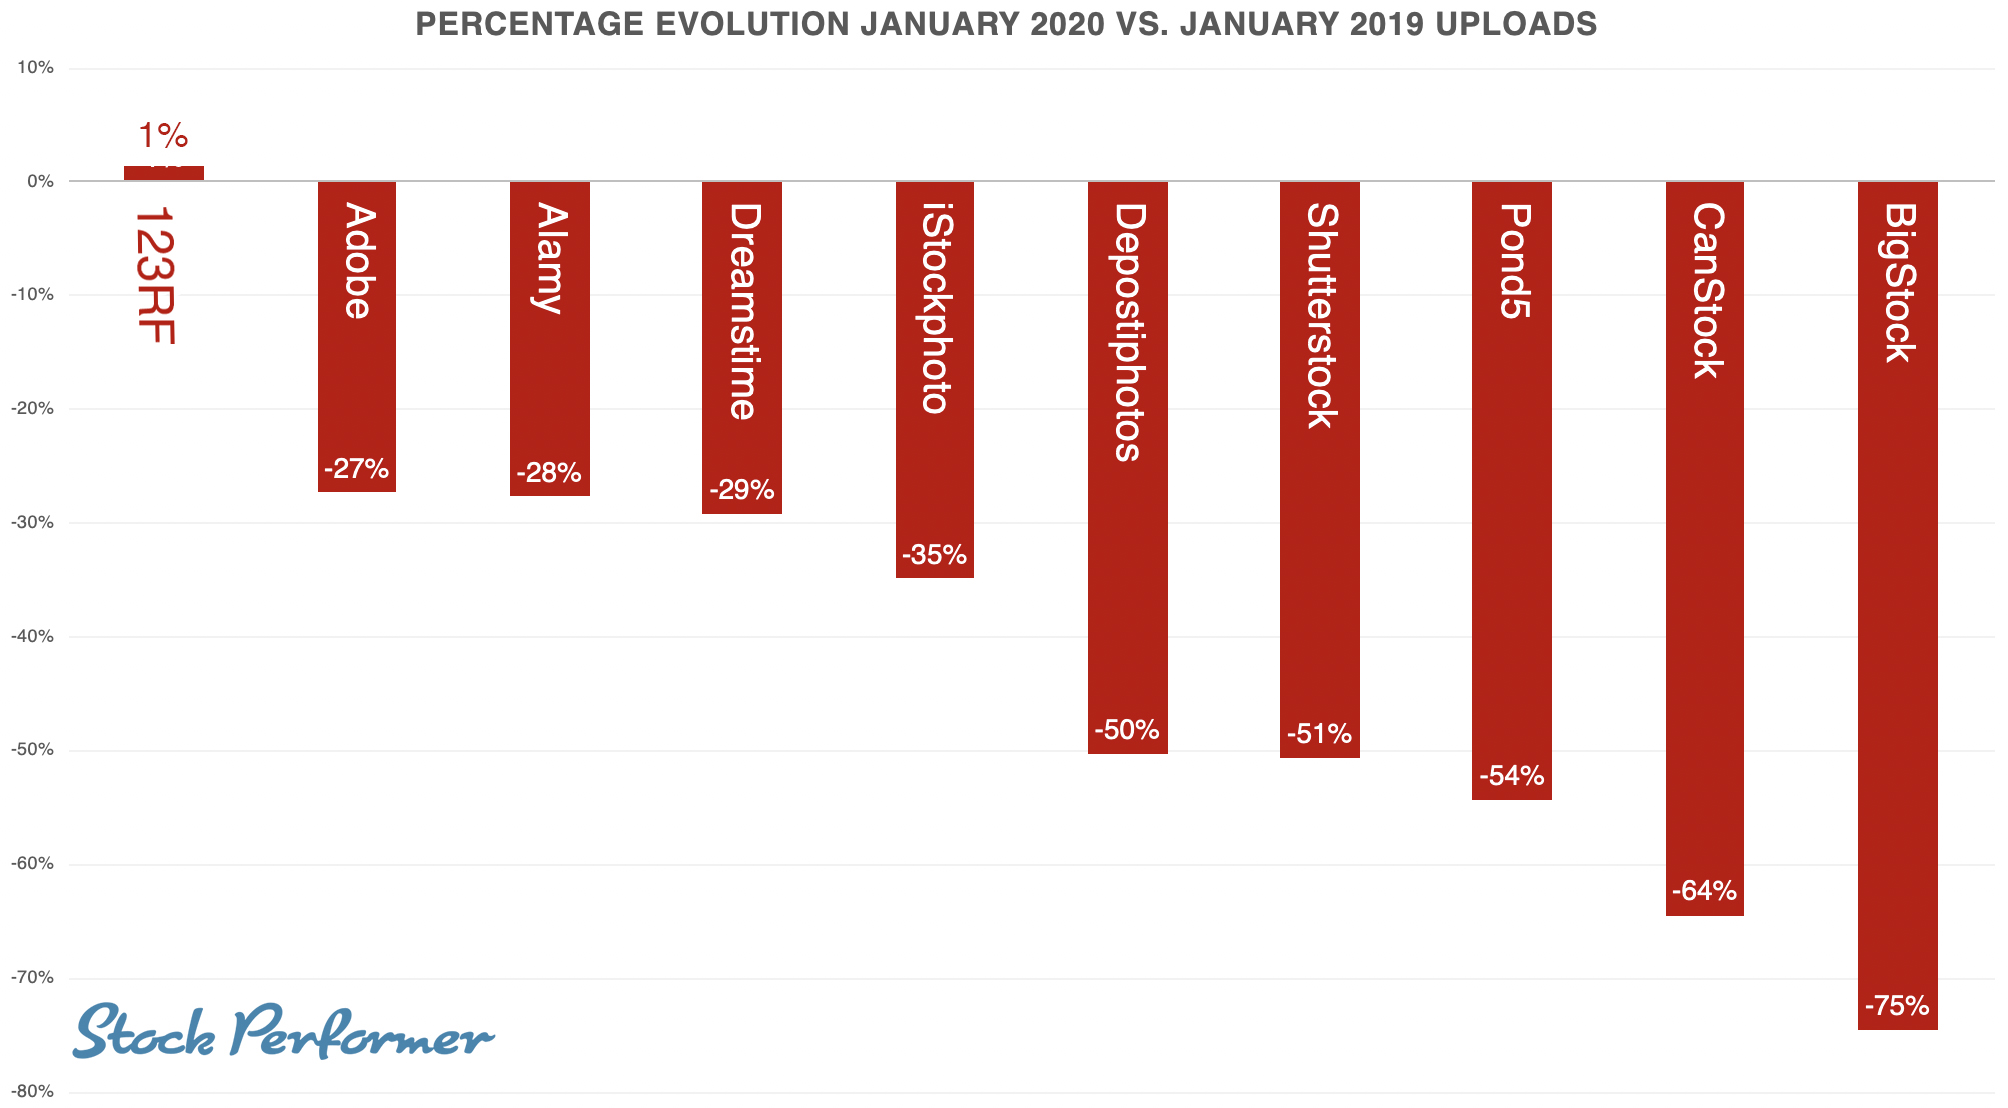
Change between all January 2020 vs January 2019 uploads per agency

One who knows what to look for in stocks immediately sees that this set of contributors has heavily reduced the amount of files they uploaded in January 2020 vs. the amount of files they uploaded in January 2019.

123RF seems to fair best, with upload counts increasing by 1%. All the other agencies are in negative territory, with Adobe receiving 27% less files this January than last January. Most affected of all seems to be BigStock with a 75% decrease.

Are we seeing a lazy start to the year? Are contributors catching up from Christmas festivities and getting up to speed to start an incredible 2020? Or is this an indicator that the energy is subsiding and some contributors are slowing down production to better face the reduction in revenue? Can we argue contributors are pessimistic about the near future?

How much did you upload in January 2020 compared to January 2019? Did you upload more? Or have you decided to reduce your output waiting for better times? Please leave a comment and share your experience!

You enjoyed these insights? Then read more here: Data Insights Series

Sign up to Stock Performer and see how we can help you make more money. The first month is completely free!

Leave a Reply for franck camhi Cancel Reply

Write a Comment

Comment

17 Comments

  1. luis … thanks a lot for this article very interesting and useful … microstock photographers are suffering of lack of informations regarding the business and maybe in this dangerous time for the industry maybe it would be great to have more to understand what’ is happening ( i dream of a real forum with top contributors sharing their experiences ) … but there is something awkward , you ask us to give you ours proper numbers but since this ranking existed you refuse to give us the number of participants to this poll … so i tell you again , if you want me to give you my numbers i will be happy to give them to everybody if i can have yours in return …best regard

    • Hi Franck, this analysis is based on just below half a million uploads in January 2020 and about 730,000 uploads in January 2019. Best Regards

      • Hi Luis, I understand you cant give away precious information to protect peoples accounts. But I am with Frank Camhi, what does it mean my earnings are at 70% and upload at 95%? What is important that this figure makes any sense at all is to know how many participants are in the game that I am compared with. And who are these contributors. Why not posting them with links to their portfolios? How can anyone make a feasable assumption if all figures are based on gut feelings? cheers

      • Hi Adam, thanks for your feedback. I understand Franck and your opinion on this matter. But we currently cannot give out the number of users in our sample. We do not reveal the number of customers we have and we will not be changing that policy. As written in reply to Franck, the graphs in this chart are based on about 730,000 uploads in January 2019 and about 430,000 in January 2020. I hope that helps you better judge the relevance of the chart.

  2. Hi Luis,
    Thanks for this very useful and interesting information.
    If possible, to have a better statistic, would be great to aggregate also the data of the upcoming months, to, say, have a quarterly statistic and better view of the uploading trend.
    I can say that, at least personally, the number of my uploads vary very much from month to month as they depend on different factors, but on a longer time frame this difference tends to disappear..
    Would be also useful to have the same chart divided for photos and videos: as there is an increasing demand on videos, Iโ€™m curious to see if they are affected as well.

    Anyway, for what it worth, in the last year, I saw an increase on my overall earnings.

  3. Interesting analysis Luis. Have you done the same comparison with December YOY? I was low on submissions in January, but it was only because we didn’t do many shoots in December. Our December was higher compared to 2018.

  4. yes Luis this really interesting information with these numbers … i think it’s the first time you give this kind of intel , what is your purpose to publish this … do you plan to give us more information like this one ?… will you give the numbers for next month and so … i hope because one month is not enough to speak about tendances ๐Ÿ˜‰

  5. good thanks … but still this work is incomplete and irrelevant .. why because we don’t know how many contributors you are talking about … let’s take an exemple based on your numbers … theses numbers completly different thing IF BY EXEMPLE : you loose 40% of your contributors in this year it’s normal that your number of this year is 40% less of upload … and it say completly something else if for exemple you gain 10% contributors from last year … sorry to insist to this point since this poll exist but as i always told you number of participant is a essential base to analyze a poll …
    So let’s be open …

    HELLO GUYS I’M OSTILL (microstock nickname) http://www.franckcamhi.com

    My total download is 1,600 000 my collection is 23 000 pictures
    my pictures are always multiple when you type a keyword sport with isolated
    my earnings are falling of 50% since two years and the last series are really poor saling
    i’m actually around 10.000 $/month
    my average is 95% of the market

    i feel that microstock market is collapsing (nothing last forever) this two next years will be “judgement day” … the signs are here that everybody start to panic … Luis is giving us numbers for the first time , Oringer is living , Adobe “photoevangelist ” (lol there are on djihad ? ) and others looking for exclusives are the first signs … so if anybody around my numbers want to share their with me you are welcome … here or on private message

    • Hello Franck, I will have to insist then too ๐Ÿ™‚ If you read the blog post I wrote “We aggregated all uploads in January 2020 and compared the sum with all uploads from the same contributors in January 2019.”. This means that we are talking about EXACTLY THE SAME contributors in January 2019 and in January 2020. That number of contributors uploaded 730,000 files in January 2019 and EXACTLY the same contributors uploaded about 430,000 in January 2020.
      Please let me know if you are still having difficulties understanding the chart we posted above.

      • so if it is … that’s a better ๐Ÿ˜‰ … but i think that march or april will be more accurate … January ( it’s not a full month a lot come back from Holliday so they didn’t upload or they upload a lot because they were travelling making photos … February is a 29/28 days month ) … if everybody thought that microstock business incomes will fall due to the number of contributors expanding nobody expected to be so hard … the difference of sale between old and new series is an average of 15 to 1 !!!! it’s crazy …. they should be other reason (my older serie still sale good and i’m on every first pages regarding sports ) i can’t find another one by lack of informations … do you have one ?

    • Hi Goran, we do not provide support via the blog. If you have noticed abnormalities in your numbers please get in touch with us so that we can look at your particular case and fix it. Thank you